















A variance report is a financial document that compares budgeted or forecasted figures against actual results for a given period. It identifies discrepancies so management can respond quickly and accurately.
Businesses use variance reports to monitor performance, manage cash flow, and improve forecasting accuracy. The report translates raw financial data into clear, actionable intelligence.
This guide covers the main types of variance reports, the formulas behind the calculations, what each report should include, and how to build a process that supports smarter financial decisions.
Key Takeaways
A variance report is a document that compares a company's projected baselines, such as budgets against actual performance for a defined period.
Variance report types include budget, revenue, cost and expense, labour, cash flow, profit, operational, and EOFY — each tracking a specific area of financial performance.
Variance report implementation activities range from establishing clear and realistic baselines, to mandating qualitative commentary.
Best practices for variance report include rolling forecasts, driver-based analysis, integrated non-financial KPIs, and choosing the right software.

What Is a Variance Report?

A variance report is a financial document that compares actual business performance against a budgeted or forecasted baseline. It calculates the differences, known as variances, between the two sets of figures, enabling business leaders to identify what is working, address inefficiencies, and manage costs effectively.
A variance report compares budgeted or forecasted figures against actual financial results for a specific period. It helps businesses identify gaps between expected performance and real-world outcomes.
In Australian business contexts, a variance report is sometimes called a variation report, particularly in project management, construction, and operations teams. Both describe the same document.
Businesses use variance reports to monitor financial performance, manage cash flow, and improve forecasting accuracy. The report turns raw accounting data into actionable financial insights.
In management accounting, variance analysis is a core part of Financial Planning and Analysis (FP&A) within a platform for accountants. Rather than reviewing every transaction, finance teams focus only on material deviations that require attention.
Variance reports also support future planning by helping businesses refine budgets and forecasting assumptions over time. Consistent reporting improves financial visibility and decision-making across departments.
4 Main Components of a Variance Report
A variance report typically contains four core components that help businesses evaluate financial performance more effectively:
- Budgeted Amount: The financial target or baseline established during budgeting and forecasting activities.
- Actual Amount: The actual revenue earned or expenses incurred during the reporting period.
- Variance Amount: The numerical difference between budgeted and actual figures.
- Variance Percentage: The percentage difference between planned and actual results, helping businesses assess the significance of the variance.
Why Variance Reporting Matters for Australian Businesses






Variance reporting is a universal accounting practice, but it carries particular weight for Australian businesses operating under the compliance and reporting frameworks of the ATO and ASIC.
1. Tracking budget vs actuals across the financial year
The Australian financial year runs from 1 July to 30 June, shaping how businesses manage budgeting, reporting, and performance reviews. Monthly variance reporting helps businesses track performance against annual financial targets throughout the year.
By identifying budget gaps earlier, management can adjust spending, sales initiatives, or cash flow planning before EOFY reporting deadlines.
2. Supporting BAS quarterly and EOFY reviews
Most Australian businesses submit BAS reports monthly or quarterly to the ATO for GST, PAYG, and related tax obligations. Variance reports help businesses compare expected and actual tax-related cash flows through a system for variance reports in Australia.
During EOFY reviews, variance reports also help accountants and auditors understand major financial movements, improving reporting accuracy and audit preparation.
3. Improving forecasting accuracy and financial decision-making
Australian businesses often face financial volatility from commodity prices, exchange rates, and interest rate movements set by the Reserve Bank of Australia (RBA). Variance reports help businesses identify where actual results differ from original financial assumptions.
This gives management better visibility for adjusting pricing strategies, operational spending, and financial forecasts based on changing market conditions.

Who Relies on Variance Reports
Variance reports support decision-making across finance, operations, and strategic planning. Different stakeholders use these reports to monitor performance, manage risks, and improve financial visibility.
Management and department heads
- Monitor departmental budgets and operational spending
- Identify performance gaps and overspending
- Track operational KPIs against targets
- Support faster corrective actions
Board of directors
- Review overall financial performance
- Monitor profitability and financial risks
- Evaluate strategic business outcomes
- Support governance and accountability
Internal and external auditors
- Review financial discrepancies and controls
- Validate reporting accuracy and compliance
- Identify unusual financial movements
- Support audit and investigation processes
Investors and lenders
- Assess business profitability and stability
- Monitor cash flow and financial performance
- Evaluate operational and financial risks
- Support lending and investment decisions
Finance teams (controllers, FP&A, CFO)
- Analyse budget-to-actual variances
- Improve forecasting and planning accuracy
- Monitor reporting consistency across departments
- Support strategic financial decision-making
Types of Variance Reports
Financial variances can occur across any area of a business. Each of the following report types focuses on a specific financial dimension, providing targeted insights for different stakeholders using variance analysis tools.
1. Budget variance report
The budget variance report compares budgeted figures against actual financial results across revenue, expenses, margins, and net income. It gives management a broad overview of business performance during a reporting period.
Reports may compare actuals against the original approved budget or a flexible budget adjusted to actual business activity levels.
2. Revenue variance report
A revenue variance report compares projected sales revenue against actual results during a reporting period. It usually separates variances into price variance and sales volume variance.
This helps businesses identify whether revenue changes were driven by pricing strategy, sales performance, or product demand shifts.
3. Cost and expense variance report
This report compares projected and actual operating expenses across departments or expense categories such as utilities, software, and travel. Manufacturing businesses may also track material and overhead variances separately.
The report helps businesses identify overspending areas and improve cost control across operations.
4. Labour variance report
A labour variance report compares expected payroll costs against actual labour expenses across departments or projects. Common metrics include labour rate variance and labour efficiency variance.
These reports help businesses monitor workforce productivity, overtime costs, and staffing efficiency more accurately.
5. Cash flow variance report
A cash flow variance report compares forecasted cash inflows and outflows against actual cash movements across operating, investing, and financing activities. This helps businesses monitor liquidity and short-term financial stability.
The report also highlights timing issues such as delayed customer payments or unexpected operational spending.
6. Profit variance report
The profit variance report compares budgeted and actual gross profit, operating profit, and net profit. It combines revenue and cost analysis to explain overall profitability performance.
This helps businesses identify whether changes in profit were driven by revenue growth, operational costs, or margin pressure.
7. Operational / KPI variance report
Operational or KPI variance reports compare target operational metrics against actual performance results. These reports often track metrics such as customer acquisition cost, churn rate, defect rates, or support response times.
The reports help businesses identify operational inefficiencies before they significantly affect financial performance.
8. EOFY variance report (annual budget review)
The EOFY variance report reviews annual financial performance across the Australian financial year from 1 July to 30 June. It typically includes detailed financial comparisons and commentary from department managers.
Businesses use this report to support annual planning, compliance reviews, and external financial audits.
9. Sales variance report
A sales variance report tracks performance at the product or territory level, covering unit volumes and selling prices, while a revenue variance report focuses on total income across the business.
This makes it relevant for operations teams monitoring fulfilment, since it shows which products or regions are missing distribution targets and may need a pricing review.
For quick reference, the table below summarises which variance report suits each business function.
Variance Report Formula
Variance reporting relies on two calculations: dollar variance and percentage variance. Both help businesses measure financial discrepancies and support budget predicting.
- For Revenue: Revenue Variance = Actual Revenue – Budgeted Revenue.
- For Expenses: Expense Variance = Budgeted Expenses – Actual Expenses.
- Dollar variance: Actual Amount – Budgeted Amount equals Dollar Variance ($).
If a department budgeted $50,000 but spent $62,000, the dollar variance is $12,000. This shows the direct financial impact of the variance.
Percentage variance = Dollar Variance / Budgeted Amount × 100
Using the same example, $12,000 divided by $50,000 equals 24%. Percentage variance helps businesses measure how significant the discrepancy is relative to the original budget.
Every variance should also be labelled as Favourable (F) or Unfavourable (U). For revenue, actual results above budget are favourable, while for expenses, actual results above budget are unfavourable because they reduce profitability.
Clear F/U labels help management interpret financial results faster without manually assessing whether each variance is positive or negative for the business.
What to Include in a Variance Report
A variance report should combine financial data, operational context, and corrective actions within one structured document. Clear reporting helps management understand what happened, why it happened, and what actions should follow.
1. Budget / forecast vs actual figures
Every report should compare budgeted or forecasted figures against actual financial results using clearly labelled reporting periods. Including Year-to-Date (YTD) figures also gives stakeholders broader performance visibility.
2. Variance amount ($) and variance percentage (%)
Each line item should display both dollar variance and percentage variance to show financial impact and proportional severity. Reports should also label variances as Favourable (F) or Unfavourable (U) for easier analysis.
3. Root cause analysis and explanatory commentary
Significant variances should include short explanations from finance teams or department managers. Commentary helps businesses understand the operational reasons behind unexpected financial results.
4. Materiality thresholds and flagging criteria
Materiality thresholds help businesses focus only on variances that exceed predefined dollar or percentage limits. This prevents management from wasting time reviewing insignificant discrepancies.
5. Action items and responsible owners
Variance reports should document corrective actions and assign ownership for follow-up activities. This helps businesses turn financial reporting into an active accountability and decision-making process.
Below is a simplified example of how material variances are typically presented in a financial variance report.
Free Variance Report Templates
Building variance reports from scratch is time-consuming. Below are structured templates for various report types that you can recreate in Microsoft Excel, Google Sheets, or your dedicated financial reporting system.
1. Monthly budget variance report template
This standard template is ideal for a high-level overview of monthly departmental or company-wide performance.
2. Revenue variance report template
This template breaks down revenue variances to separate pricing impact from sales volume changes. It is structured to align with Australian business reporting requirements and operational use cases.
3. Expense & cost variance template
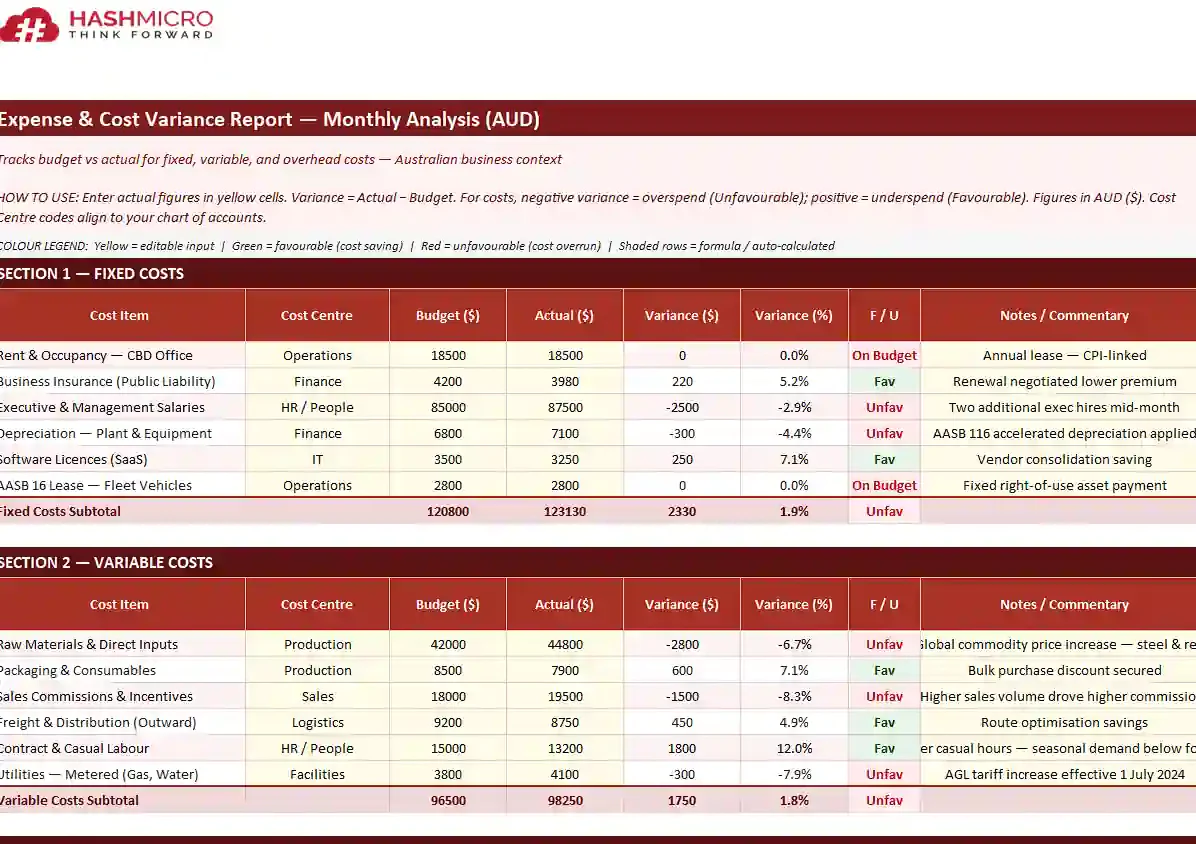
This template separates operating costs into fixed costs, variable costs, and overhead to identify where spending differs from budget. Each section includes budget, actuals, dollar variance, percentage variance, and F/U indicators.
A management commentary section is also included for explaining significant variances before finance or board review.
Expense & Cost Variance Template
4. Labour variance report template
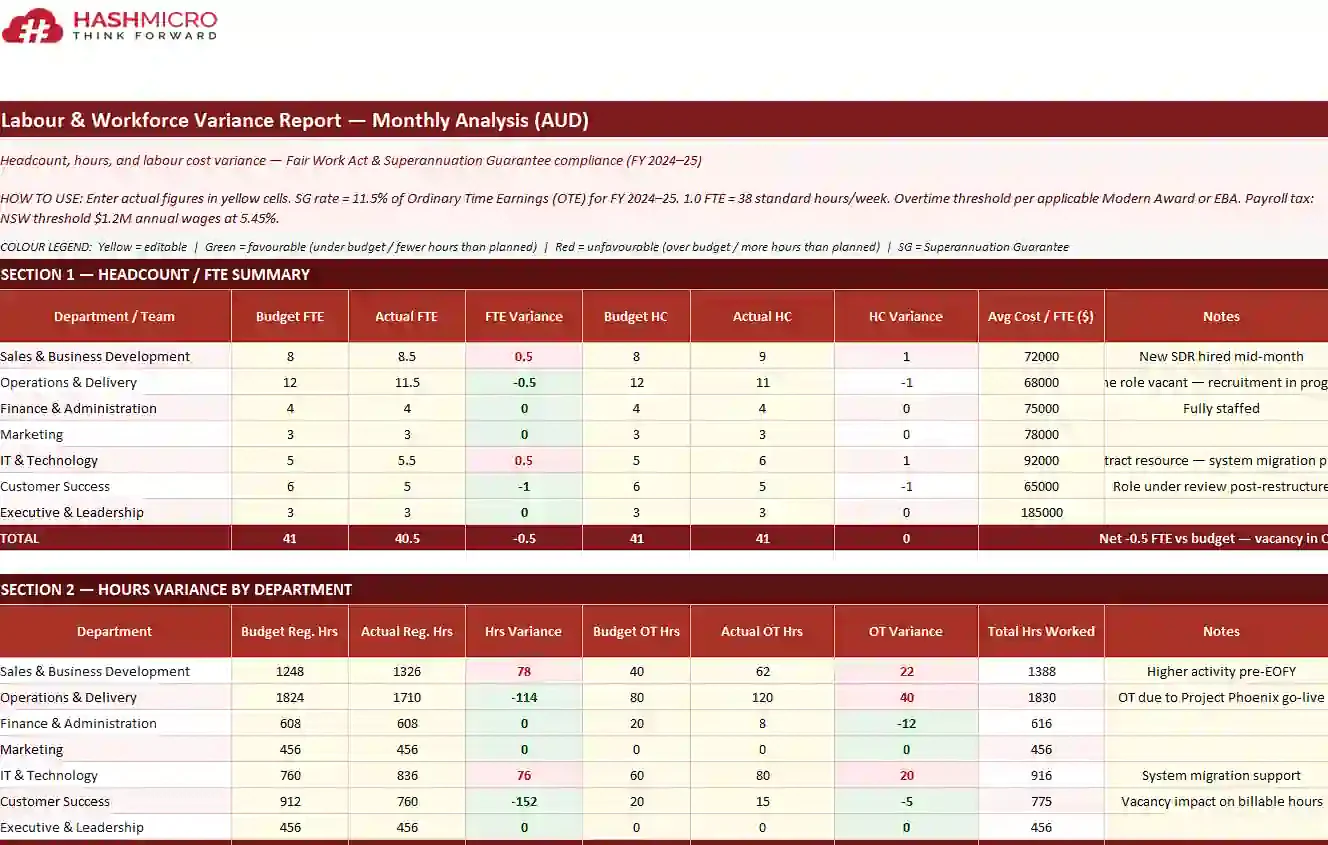
This template tracks workforce variance across headcount, overtime, and total labour costs, including salaries, casual labour, and overtime premiums. It also includes payroll tax, allowances, and superannuation guarantee calculations for FY 2024–25.
The workbook is designed for finance and HR teams to review together before month-end reporting.
Labour variance report template
5. Cash flow variance report template
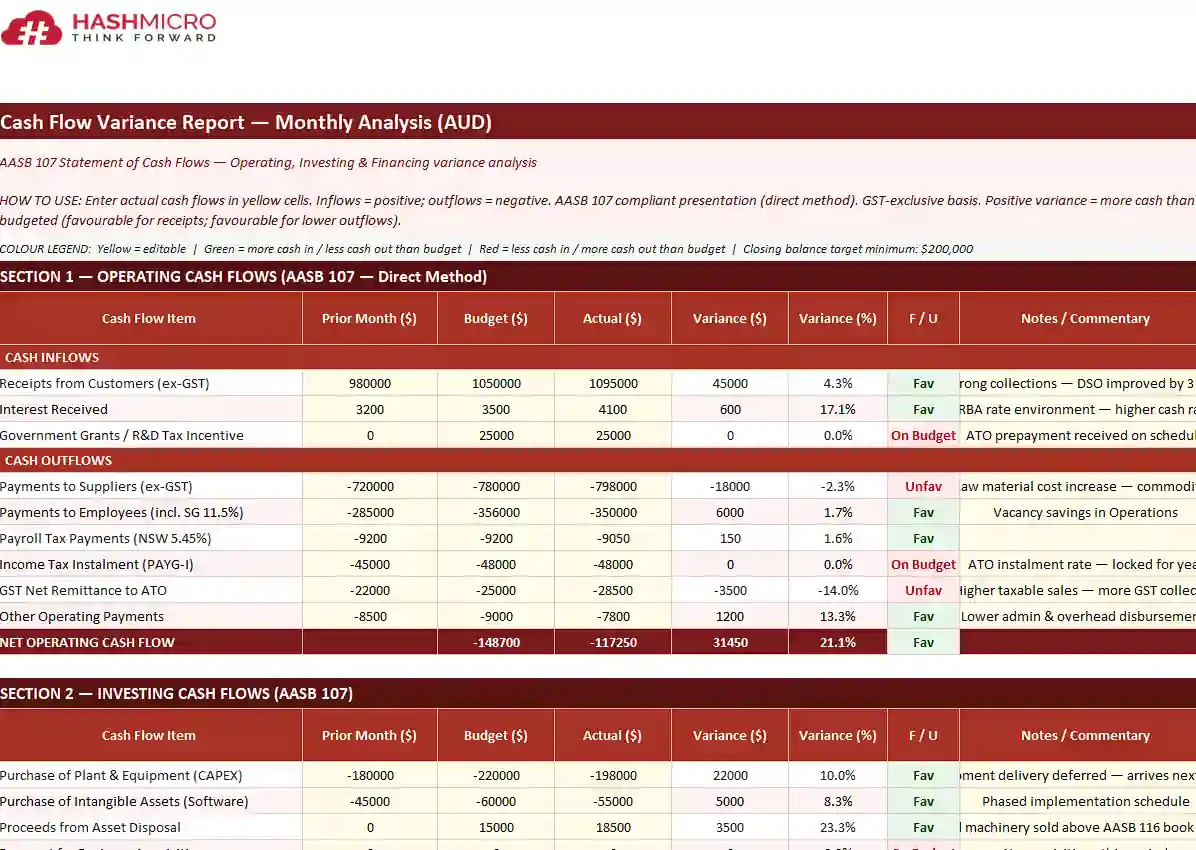
Structured around AASB 107, this template compares operating, investing, and financing cash flows against budget. It includes GST-related receipts, ATO payments, CAPEX, loan repayments, and cash balance tracking.
A summary section helps businesses monitor opening and closing cash positions more efficiently.
Cash flow variance report template
6. Quarterly BAS variance template
Built for Australian BAS reporting, this template compares budgeted and actual GST, PAYG withholding, and FBT obligations for the quarter. It also includes input tax credits, fuel tax credits, and employee withholding calculations where applicable.
An ATO compliance checklist is included to help businesses review lodgement requirements before submission deadlines.
7. EOFY annual variance summary template
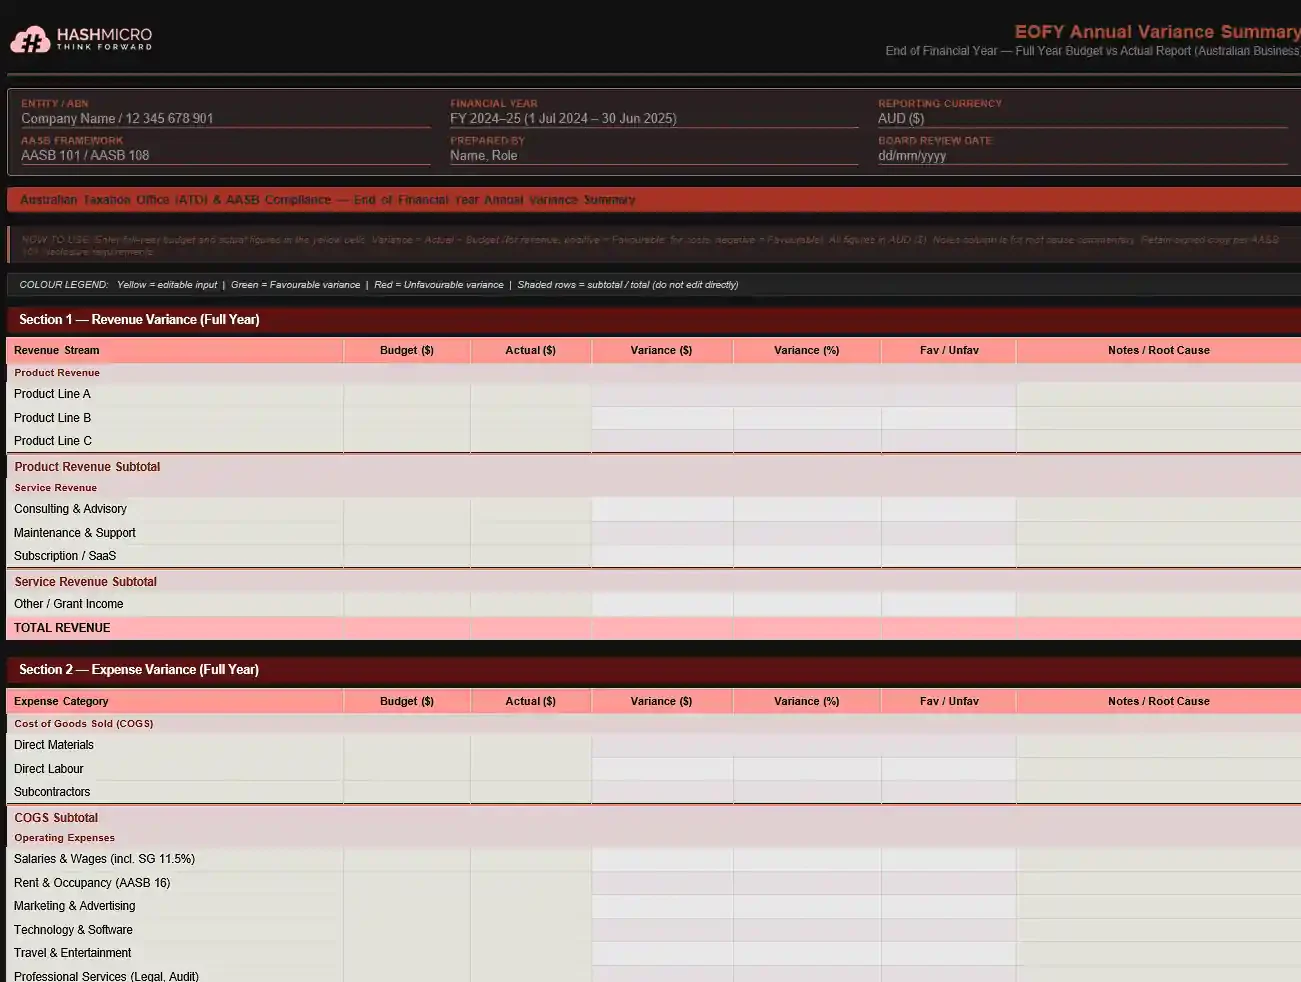
This EOFY template reconciles annual revenue, expenses, EBITDA, and net profit against budget and prior year performance. It also includes quarterly comparisons and year-on-year financial tracking.
An AASB and ATO compliance checklist plus CFO, CEO, and board sign off sections are included for governance and reporting purposes.
EOFY annual variance summary template
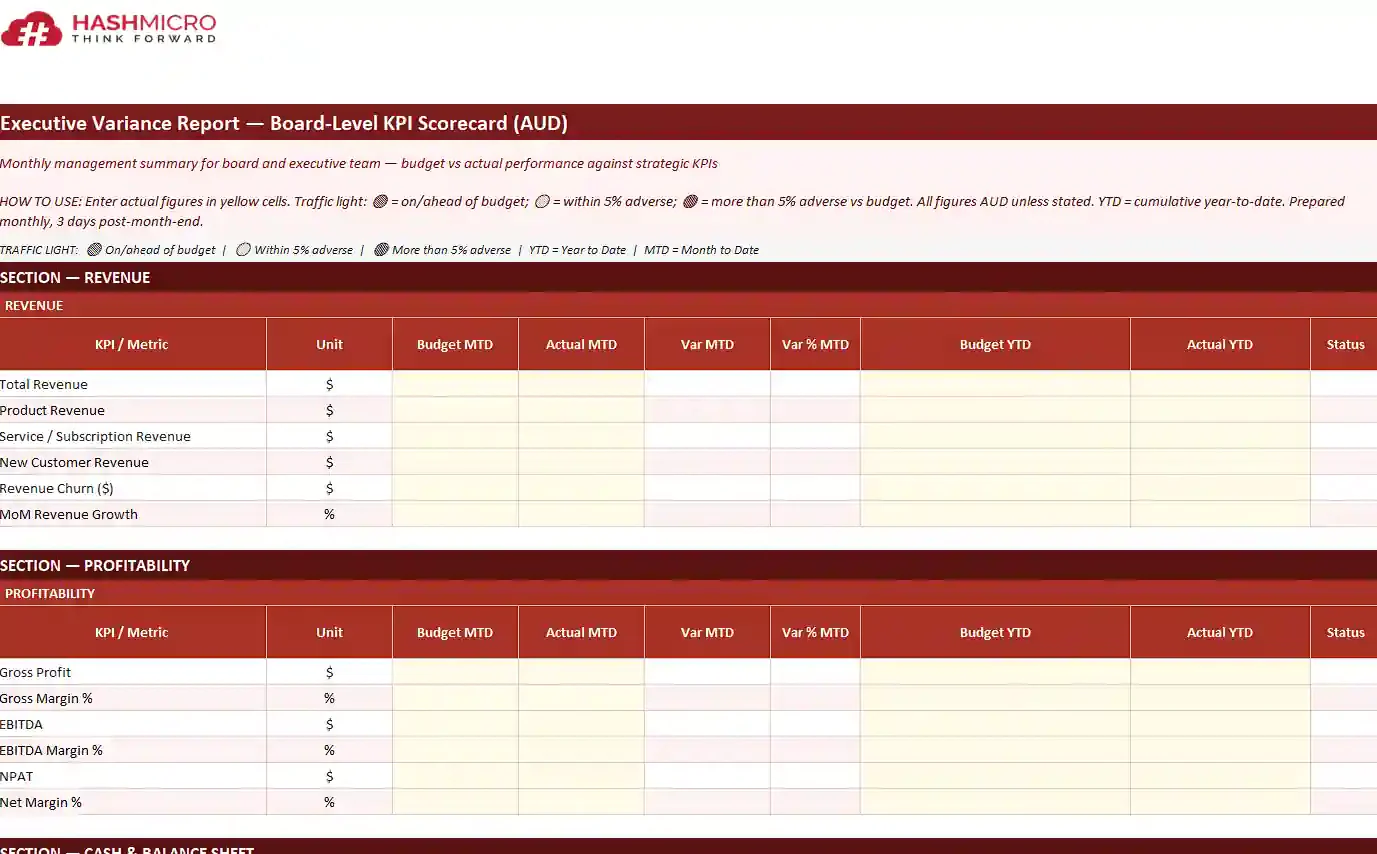
8. Executive variance report template
This board-ready template consolidates financial and operational KPIs into a single executive scorecard with traffic light ratings. It includes month to date and year-to-date comparisons across revenue, EBITDA, NPAT, cash, and working capital metrics.
The template also highlights major favourable and unfavourable variances with root cause commentary for board-level reporting.
Executive variance report template
Industry-Specific Use Cases for Variance Reporting
Variance reporting principles apply across industries, but the financial metrics and operational drivers being monitored often differ depending on business models and operational priorities.
1. Manufacturing and production
Manufacturing businesses use variance reports to monitor raw material costs, labour efficiency, and production performance. These reports help identify supply chain cost changes, production inefficiencies, and operational bottlenecks.
Common metrics include material price variance, material usage variance, and labour efficiency variance to protect profitability and improve operational control.
2. Retail and e-commerce
Retail and e-commerce businesses use variance reports to monitor sales performance, inventory movement, and marketing efficiency while supporting BAS compliance on variance report processes. These reports help businesses manage thin margins and seasonal demand changes.
Common areas tracked include sales volume variance, inventory shrinkage, pricing variance, and marketing spend versus return on ad spend (ROAS).
3. SaaS and technology
SaaS and technology businesses use variance reports to monitor recurring revenue, customer acquisition costs, churn, and infrastructure spending. These reports help businesses maintain profitability and operational efficiency.
Common metrics include ARR variance, CAC variance, and cloud infrastructure cost variance across finance and operational teams.
4. Healthcare and medical services
Healthcare providers use variance reports to monitor staffing costs, patient volumes, medical supply expenses, and operational efficiency. These reports help administrators manage financial performance alongside service delivery requirements.
Common areas tracked include patient volume variance, medical supply cost variance, and staffing overtime variance across healthcare operations.
Implementation Guide for Variance Reporting
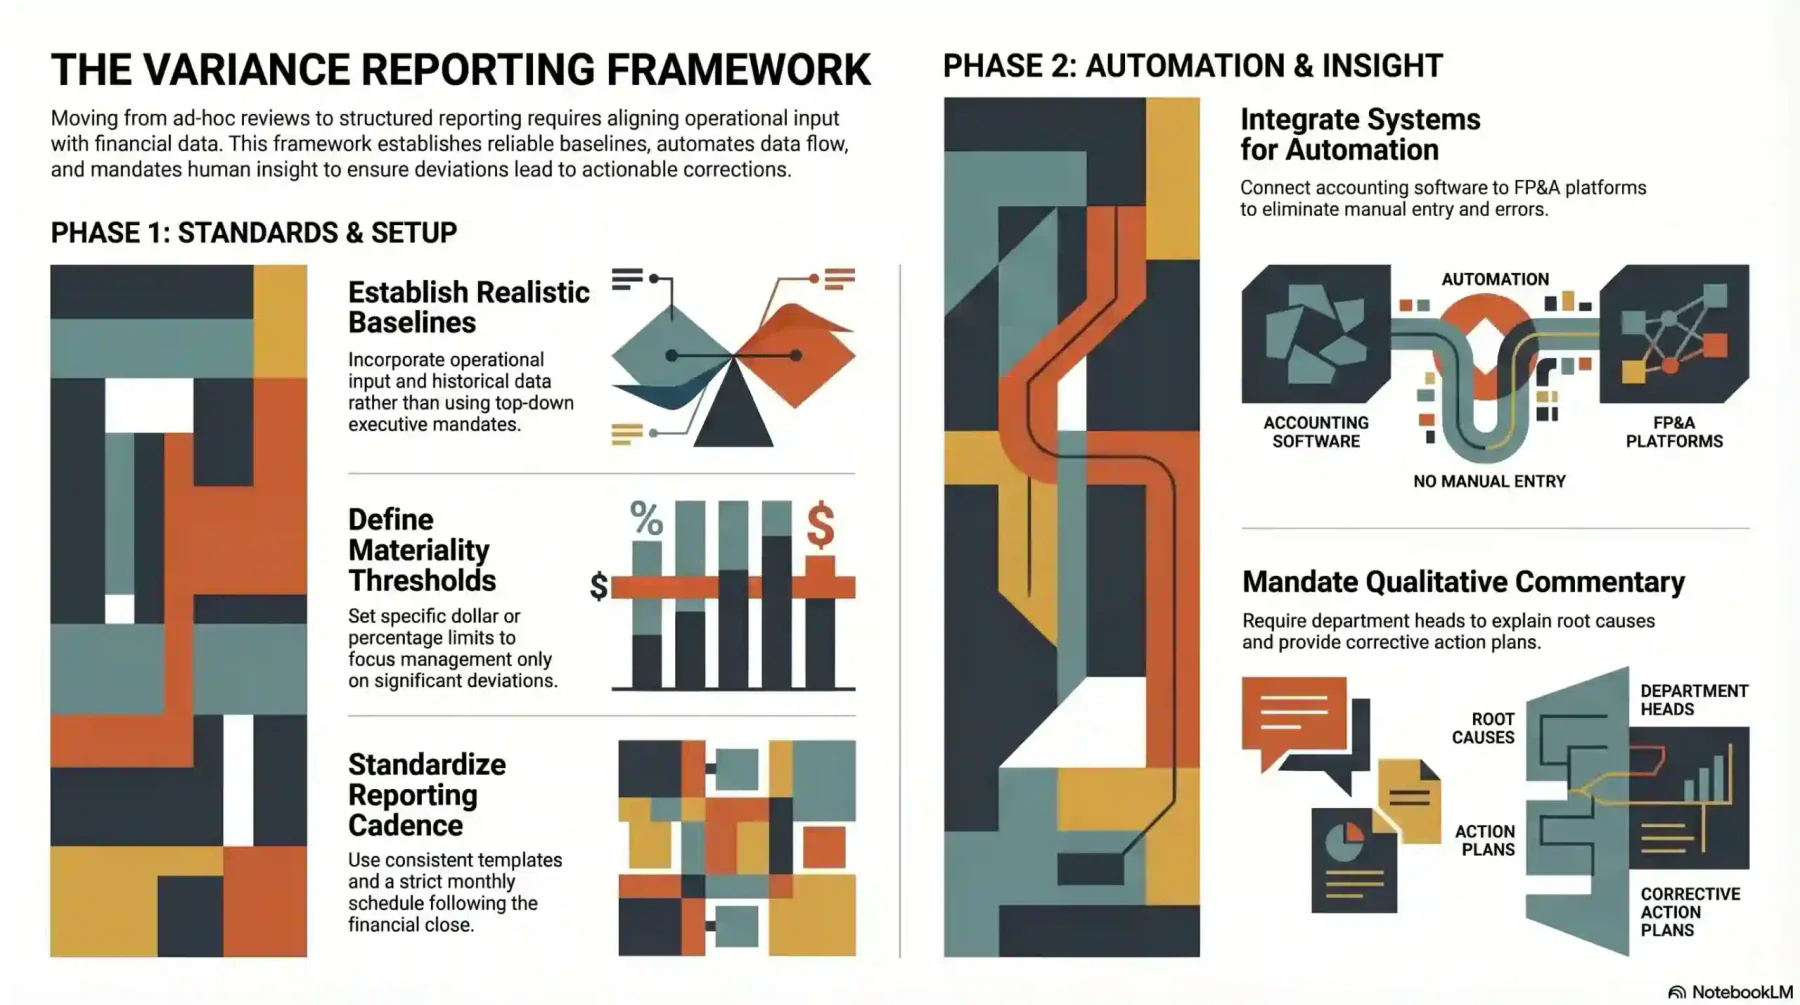
Moving from ad-hoc financial reviews to a structured process requires careful planning and cross-functional alignment. The following framework will help you get there.
1. Establish clear and realistic baselines
Variance reports are only useful when budgets and forecasts reflect realistic operational conditions. Businesses should involve department heads, historical performance, and current business factors when setting financial baselines.
2. Define materiality thresholds
Not every variance requires investigation. Setting materiality thresholds helps businesses focus only on deviations that materially impact financial or operational performance.
3. Standardise the reporting cadence and format
Businesses should use consistent reporting schedules and standardised templates across departments. Reports should clearly display budget, actuals, dollar variance, and percentage variance for easier analysis.
4. Integrate financial systems for automation
Manual data entry increases reporting delays and reconciliation risks. Integrating accounting and FP&A systems helps businesses automate data flows and improve reporting accuracy.
5. Mandate qualitative commentary
Finance teams and department managers should provide explanations for significant variances, including root causes and corrective actions. This gives management clearer operational context behind the numbers.
Common Pitfalls to Avoid in Variance Analysis
Even experienced finance teams can fall into systemic errors. Awareness of these pitfalls is the first step toward keeping your reports accurate and valuable.
1. The “blame game” culture
Variance reports should support operational improvement, not employee punishment. Using reports as a punitive tool may encourage inaccurate budgeting or overly conservative forecasts.
2. Ignoring favourable variances
Favourable variances should still be reviewed because underspending or higher than expected results may indicate missed operational activities or inaccurate budget allocation.
3. Relying on static budgets in volatile markets
Static annual budgets can become unreliable when market conditions change significantly. Rolling forecasts help businesses maintain more relevant financial benchmarks throughout the year.
4. Lack of actionable follow-up
Variance reporting becomes ineffective when businesses identify issues without assigning corrective actions or responsible owners. Follow-up processes are necessary to maintain accountability and financial discipline.
Advanced Practices in Modern Variance Reporting
Modern variance reporting helps businesses improve forecasting accuracy and financial visibility beyond historical reporting.
- Shifting to rolling forecasts: Rolling forecasts replace static annual budgets with continuously updated projections.
- Driver-based variance analysis: Variances are broken down into drivers such as price, volume, and product mix.
- Integrating non-financial KPIs: Financial reports are combined with operational KPIs for broader business visibility.
- Using accounting software to automate variance calculations: Integrated systems automate calculations, reporting workflows, and variance alerts.
How Accounting Systems Simplify Variance Reporting Across Business Modules
According to ABS data, only around 4% of Australian businesses currently use ERP systems, while most still rely on basic digital tools or spreadsheets. This gap explains why so many finance teams build variance reports manually each month, and why moving to an integrated ERP removes the largest source of reporting delay.
- Centralised financial data improves visibility across departments and reporting periods.
- Integrated systems connect sales, inventory, payroll, AR/AP, and general ledger data within one platform.
- Finance teams can compare budget and actual figures using a single source of truth.
- Real-time general ledger integration reduces delays in month-end reporting.
- Automated workflows eliminate manual data entry and spreadsheet reconciliation.
- Materiality thresholds can automatically flag favourable and unfavourable variances for review.
Conclusion
Variance reports help businesses compare budgeted and actual financial results to improve spending control, financial visibility, and decision-making. Structured reporting also helps management identify operational issues earlier across departments.
Businesses looking to improve reporting accuracy and reduce manual financial processes can request a no-cost consultation with us anytime to explore suitable accounting and ERP solutions.