















You must be familiar that corporate generate large volumes of transactions every day. Without a clear framework to interpret them, it becomes difficult to understand the company’s real financial position. Proper financial reporting provides the structure needed to make sense of this data.
Financial reporting acts as the main communication link between a company and its stakeholders, including management, investors, and regulators. It goes beyond compliance by translating daily operations into measurable financial results that can be analysed and compared.
Through standardised reports, businesses can track performance across periods and industries, helping investors make informed decisions. Managers also use these insights to guide strategy, control costs, and drive sustainable profitability for the company.
Key Takeaways
Financial reporting is the systematic process of documenting and communicating a company's financial activities to stakeholders for transparency and decision-making.
The four core types include the Balance Sheet, Income Statement, Cash Flow Statement, and Statement of Shareholder Equity, each serving a unique analytical purpose.
Accurate financial reporting in Australia ensures compliance, transparency, and proper record-keeping for all companies under AASB standards.
Implementing automation, ensuring data integrity, and shortening reporting cycles are essential best practices for modern financial management.

What is Financial Reporting?
Financial reporting is the process of recording, summarising, and presenting financial data to show a company’s performance and position. It transforms daily transactions into structured reports for investors, creditors, regulators, and the public.
At its core, financial reporting promotes transparency and trust. Beyond financial statements, it includes footnotes, management discussion, and supporting schedules that explain the numbers.
Financial reporting serves both external and internal audiences. External reports follow AASB or IFRS, while internal reports focus on operational insights such as segment performance and budget variances.
Technology has expanded financial reporting from historical records to real time insights and forecasts. With modern accounting software for bussiness, finance teams can automate reporting and support strategic decision making.
The Purpose of Financial Reporting
- Enable informed economic decision making
Financial reports help investors evaluate risk and return when allocating capital. Reliable reporting lowers uncertainty and reduces a company’s cost of capital. - Ensure regulatory compliance and market transparency
Public companies must publish financial results to maintain fairness and trust. Standardised rules reduce fraud and support confidence in the financial system. - Assess creditworthiness for lenders
Banks and creditors use financial statements to evaluate liquidity, leverage, and repayment capacity. Reporting quality directly affects financing access and borrowing costs. - Guide internal management decisions
Executives use reports to track performance against strategic goals. Financial statements act as a feedback mechanism for cost control, growth, and investment planning.
Types of Financial Reporting

Financial reporting consists of multiple statements, each answering a different question about the business. The four core statements are the Balance Sheet, Income Statement, Cash Flow Statement, and Statement of Shareholder Equity.
These statements are interconnected. Net income flows into equity, operating cash affects the balance sheet, and true analysis requires reviewing how the statements work together.
Beyond these core statements, businesses also rely on types of budget reports to track spending against targets. These sit alongside formal financial statements as internal planning tools.
1. Balance Sheet
The Balance Sheet shows a company’s financial position at a specific date. It follows the equation Assets = Liabilities + Equity and must always remain balanced.
Assets represent resources expected to generate future benefits. Current assets support short term liquidity, while non current assets support long term operations.
Liabilities and equity show how assets are financed. Their relationship provides insight into leverage, risk, and financial stability.
2. Income Statement
The Income Statement measures performance over a period by summarising revenue, costs, and expenses. It shows whether the company generated a profit or loss.
It highlights operational efficiency by separating production costs from operating expenses. Margin analysis helps identify cost pressures and inefficiencies.
Investors use this statement to track profitability trends. Non operating items such as interest and taxes reflect financing and tax strategy impacts.
3. Cashflow Statement
The Cash Flow Statement tracks actual cash movements in and out of the business. It is essential for managing liquidity and short term obligations.
It is divided into Operating, Investing, and Financing activities. Operating cash flow reflects core business health, while other sections show growth and funding activities.
This statement reveals sustainability better than profit alone. Strong profits without cash flow may signal underlying financial risk.
4. Statement of Shareholder Equity
This statement explains changes in shareholders’ ownership over time. It links net income, dividends, and share issuances to total equity.
Retained earnings show profits reinvested in the business. Consistent growth often indicates financial stability and internal funding strength.
It also records share buybacks and new issuances. These changes affect ownership structure and shareholder value.






Benefits of Financial Reporting
- Supports faster and better management decisions
Accurate and timely reports help identify inefficiencies, declining margins, and rising costs early. This allows management to take corrective action before issues escalate. - Improves access to funding
Transparent reporting reduces perceived risk for lenders and investors. This can lead to better loan terms, easier capital access, and stronger investor confidence. - Enhances tax planning and risk management
High quality reporting ensures accurate tax filings and helps identify legitimate deductions. Weak reporting increases audit risk, penalties, and reputational damage.
Financial Reporting Requirements in Australia
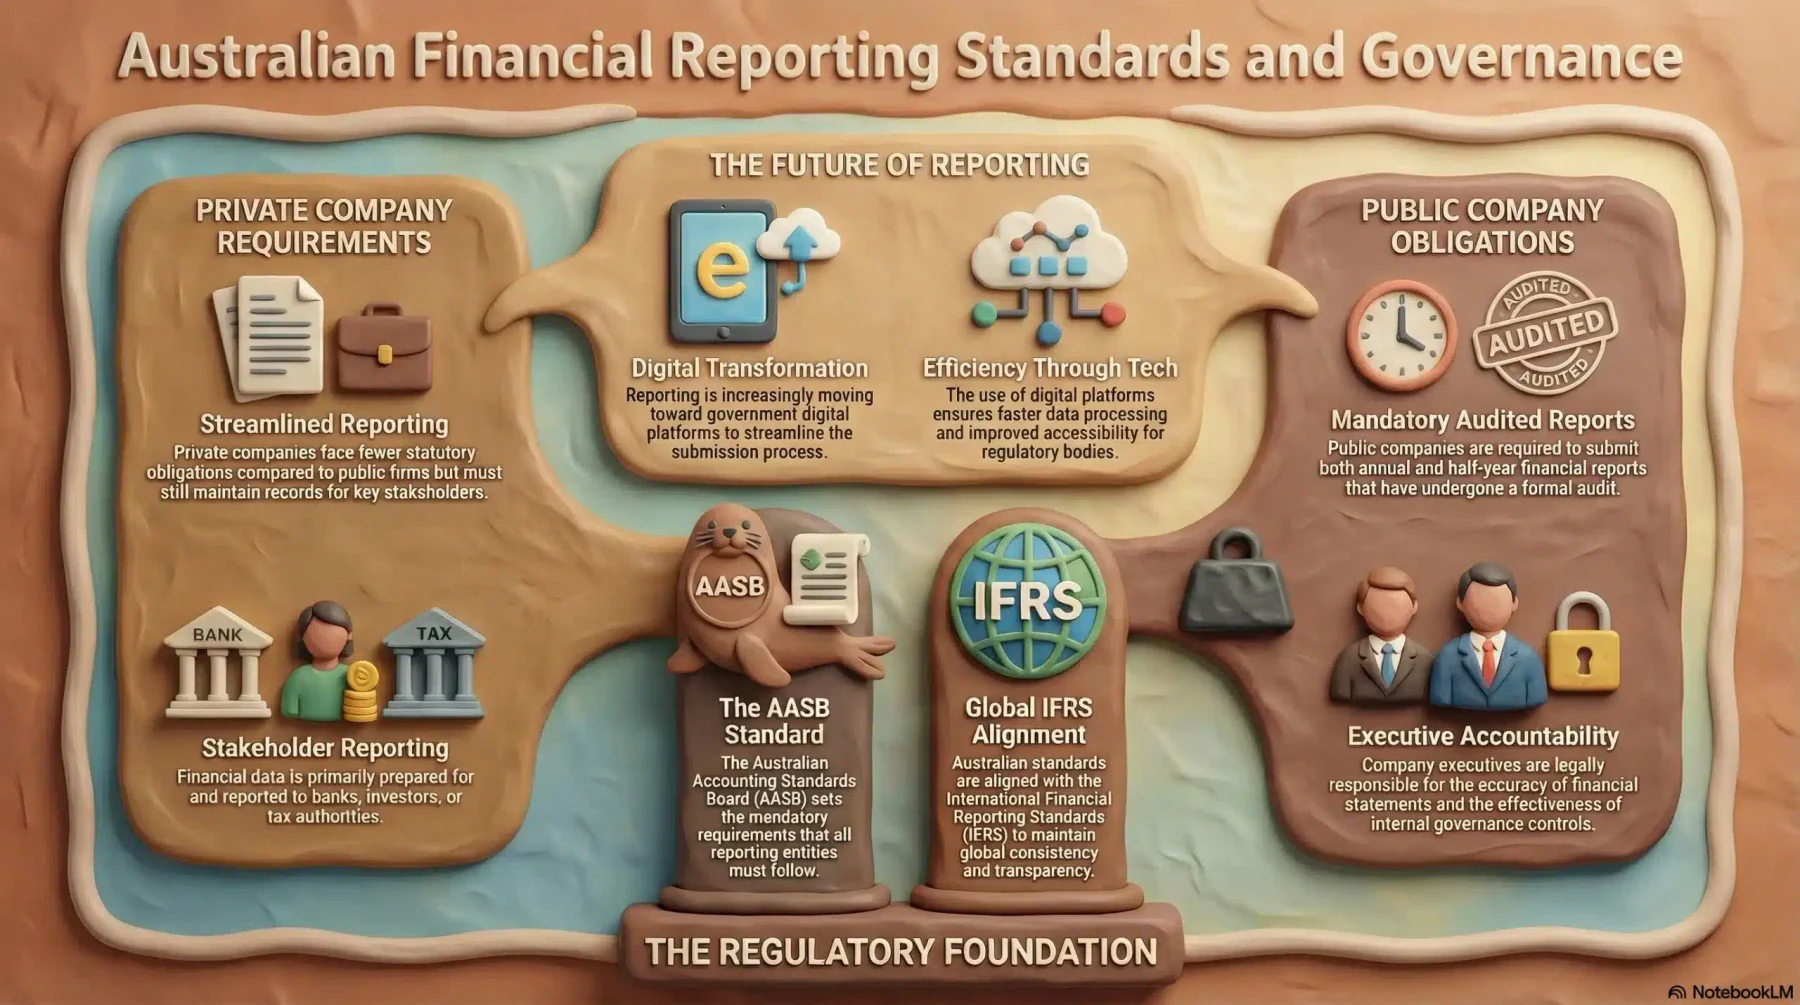
Financial reporting requirements vary by company size and structure. In Australia, standards are set by the Australian Accounting Standards Board (AASB) and aligned with IFRS to ensure consistency and transparency.
Public companies face stricter obligations, including audited annual and half year reports. Executives are responsible for accuracy and internal controls under governance rules.
Private companies have fewer requirements but still report to banks, investors, or tax authorities. Digital reporting through government platforms is increasingly common.

Best Practices for Financial Reporting

- Centralize financial data
Consolidating data into one system reduces duplication and inconsistencies. Using integrated finance management software creates a single source of truth and improves accuracy across departments. - Reduce manual processes through automation
Manual spreadsheets increase error risk and slow the financial close. Automated journal entries, reconciliations, and consolidations improve speed, accuracy, and audit trails. - Adopt standardized reporting structures
Standard charts of accounts and reporting formats simplify consolidation, especially for multi-branch businesses. This enables consistent comparison and clearer financial analysis. - Use dashboards and contextual reporting
Visual dashboards and clear explanations help executives quickly understand KPIs and trends. Presenting both numbers and context turns reports into actionable decision tools.
Industry-Specific Nuances in Financial Reporting
Although core accounting principles remain consistent, financial reporting differs across industries. Reports must reflect business models, cost structures, and revenue drivers.
Manufacturing, retail, distribution, and e-commerce each track different performance metrics. Tailored reporting ensures financial data supports operational and strategic decisions.
1. Manufacturing: Cost Accounting and Efficiency
Manufacturing reporting focuses on cost accounting and inventory valuation. Accurate tracking of raw materials, WIP, and finished goods prevents misstated profits.
Reports analyse production costs through absorption costing and variance analysis. Operational metrics are often linked to financial dashboards.
Inventory turnover and aging reports help control excess stock. This protects working capital and asset accuracy.
2. Retail: Margin Analysis and Store Performance
Retail reporting emphasises store level performance and inventory speed. Four Wall Analysis helps identify profitable and underperforming locations.
Metrics like Same Store Sales and GMROI measure growth and inventory efficiency. These guide product and pricing decisions.
Seasonality is managed using trailing twelve month analysis. This avoids misreading short term demand fluctuations.
3. Distribution and Logistics: Margin Per Shipment
Distribution reporting focuses on margin per shipment and cost to serve. Some high revenue customers may be unprofitable due to service complexity.
Working capital metrics such as DSO and DPO are critical. Cash flow timing directly affects inventory purchasing ability.
Forward looking cash flow forecasts help manage liquidity. This supports stable operations in low margin environments.
4. E-commerce: Unit Economics and Acquisition Costs
E-commerce reporting centres on unit economics and contribution margin per order. This shows true profitability after variable costs.
Marketing efficiency is tracked using CAC, LTV, and their ratio. Returns are analysed at product level to protect margins.
Combining financial and digital metrics ensures sustainable growth. This links accounting data with customer behaviour.
Strategic Implementation Framework: From Data to Decision
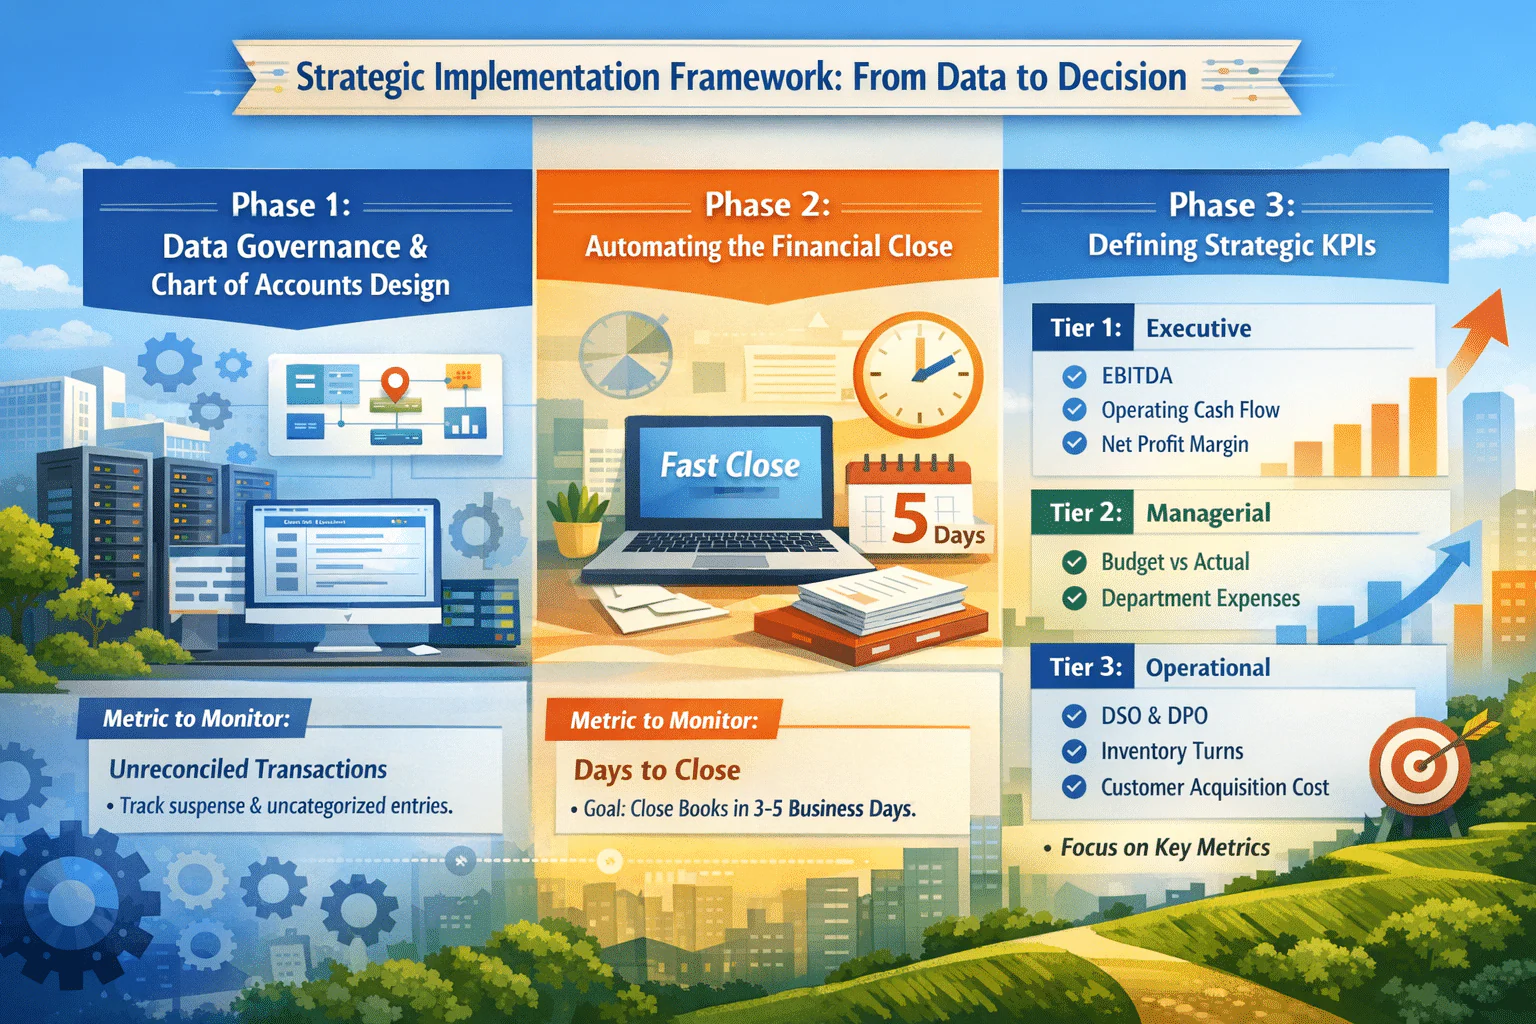
Implementing a financial reporting system is a change management process, not just a software setup. Data accuracy must come before advanced analysis.
1. Data Governance and Chart of Accounts Design
The Chart of Accounts is the foundation of reporting quality. A scalable design uses segments instead of excessive ledger accounts.
Metric to Monitor: Unreconciled transactions. During system setup or daily operations, companies should closely track entries placed in suspense or uncategorized accounts. A high volume may signal data entry issues or process gaps that need immediate correction.
2. Automating the Financial Close
Timeliness is critical for decision making. Reports delivered quickly provide insight, not just history. Automation of journals, reconciliations, and adjustments shortens the close cycle. Modern systems support continuous accounting instead of month end dependency.
Metric to Monitor: Days to Close. Leading finance teams aim to close their books within 3 to 5 business days. Monitoring improvements in this metric helps measure the success of system implementation and process efficiency.
3. Defining Strategic KPIs
Once data is accurate and delivered on time, the next step is choosing the right metrics. A common mistake is KPI overload, where too many indicators reduce clarity and focus. Companies should create a clear hierarchy so each level of management sees only what is relevant to their role.
- Tier 1 (Executive): EBITDA, Operating Cash Flow, Net Profit Margin.
- Tier 2 (Managerial): Budget vs Actual Variance, Departmental Operating Expenses, Headcount Ratios.
- Tier 3 (Operational): Days Sales Outstanding (DSO), Days Payable Outstanding (DPO), Inventory Turns, Customer Acquisition Cost (CAC).
Common Pitfalls and Mitigation Strategies

Even with sophisticated tools, financial reporting initiatives often fail to deliver value due to process flaws or behavioral biases. Recognizing these pitfalls early is essential for maintaining the integrity of the financial narrative.
1. The Trap of Historical Bias
The Pitfall: Traditional financial reporting is inherently backward-looking. It tells you what happened last month, not what will happen next month. relying solely on historical data can lead to reactive management, where decisions are made to fix past problems rather than seize future opportunities.
Mitigation: Shift from static reporting to Rolling Forecasts. Instead of holding to an annual budget that becomes obsolete by Q2, implement a 12-month rolling forecast that updates monthly based on recent actuals. This forces the businesses to constantly look forward and adjust resources based on current trajectories.
2. Inconsistent Revenue Recognition
The Pitfall: ASC 606’s complexity makes consistent revenue recognition challenging, especially for subscriptions, bundled services, or long-term contracts. Inconsistencies can cause volatile monthly P&Ls, confusing investors and internal teams.
Mitigation: Use a centralized Revenue Recognition Engine in your ERP instead of manual spreadsheets. Automating the revenue “waterfall” ensures compliance and gives a clear view of recognized versus deferred revenue.
3. Data Silos and Excel Dependency
The Pitfall: “Excel Hell” happens when the true numbers live in offline spreadsheets, causing version conflicts, security risks, and formula errors. With Finance, Sales, and Operations using different sheets, trust in revenue reporting disappears.
Mitigation: Create a Single Source of Truth (SSOT). Only reports from the centralized Data Warehouse or ERP should be official. Use BI tools like Tableau, Power BI, or Looker to pull data directly, avoiding manual errors.
Conclusion
Financial reporting shows how business performance is understood and improved, requiring accuracy and consistency. Balance Sheets, Income Statements, and Cashflow Statements give stakeholders the insights they need. High-quality reporting affects reputation, capital access, and operational agility.
Companies that treat reporting as a strategic asset can build investor trust and drive sustainable growth. If you are looking to strengthen your financial systems and reporting framework, it may be time to explore your options with an expert and identify the right solution for your business.

Frequently Asked Question
Financial reporting focuses on providing standardized historical data to external stakeholders like investors and regulators for compliance. Management reporting is internal, flexible, and detailed, focusing on operational metrics to help executives make day-to-day business decisions.
The Cash Flow Statement reveals the actual liquidity of a business, stripping away non-cash accounting items like depreciation. Analysts value it because a company can show profit on the Income Statement but still fail if it lacks the cash flow to pay its immediate obligations.
GAAP is rules-based and primarily used in the US, offering specific guidance for accounting scenarios. IFRS is principles-based and used internationally, offering broader guidelines that require more interpretation, allowing for flexibility but potentially less consistency.
Automation reduces human error by eliminating manual data entry and ensures data consistency across reports. It accelerates the financial close process, allowing finance teams to focus on strategic analysis rather than data gathering.
XBRL (eXtensible Business Reporting Language) is a global standard for exchanging business information digitally. It tags financial data electronically, making it machine-readable, which allows investors and regulators to instantly analyze and compare data across different companies.