















Effective inventory management is the backbone of any successful product-based business. Whether you run a manufacturing site, a retail store, or an e-commerce brand, the challenge stays the same. You must keep the right stock available without locking up cash.
Too much inventory increases storage costs, raises the risk of obsolete stock, and limits cash flow. Too little inventory causes stockouts, delays, and unhappy customers. Both situations directly affect revenue and operational stability.
Many businesses still rely on instinct to manage stock levels. While experience helps, it cannot handle growing product ranges and volatile demand. A structured, data-driven approach isoften supported by inventory tracking software.
ABC analysis provides that structure. It helps a company prioritise inventory based on value and impact. This focus allows teams to spend time and money where it matters most.
Key Takeaways
Learn how ABC analysis ranks inventory by value to improve stock control and cash flow.
Understand how each inventory category behaves and why management rules vary.
Explore how ABC analysis reduces costs, improves forecasting, and strengthens purchasing decisions.
Examples of how different sectors apply ABC analysis to real-world inventory challenges.

What Is ABC Analysis?
ABC analysis is an inventory classification method that ranks items by their importance to the business. It highlights which products drive most of the value. This insight supports smarter purchasing and stock control decisions.
The method applies the Pareto Principle to inventory management. In practice, a small percentage of SKUs often generate most inventory value. Managing all items the same way usually leads to inefficiency.
ABC analysis divides stock into three categories using annual consumption value. High-value items need tighter control, while low-value items need simpler rules.
This approach helps a business protect cash flow and reduce inventory risk, especially when supported by a scalable stock managing solution.
The Three ABC Categories Explained
To understand how ABC analysis works in practice, you need to look at how each category behaves and how a business should manage it. While percentages can shift by industry, the overall pattern stays consistent across retail, manufacturing, and distribution in Australia.
Class A Items
Class A items are the most valuable products in a company’s inventory. They usually make up only 10 to 20 percent of total SKUs but generate around 70 to 80 percent of annual inventory value.
Because of their impact, these items require tight control and close attention. A business keeps safety stock low, relies on accurate forecasting, and works closely with key suppliers to avoid delays or excess capital lock-up.
Class B Items
Class B items sit between high and low priority stock. They often represent about 30 percent of SKUs and contribute roughly 15 to 20 percent of total inventory value.
These items need regular monitoring but not daily oversight. Many businesses review them monthly and watch trends closely, as Class B products can move up to Class A or slide down to Class C over time.
Class C Items
Class C items make up most of the physical inventory but deliver the least financial value. They typically account for 50 to 60 percent of SKUs and only 5 to 10 percent of total consumption value.
The goal here is efficiency, not precision. Businesses automate ordering, buy in bulk, and hold higher safety stock to avoid disruptions from low-cost items running out.
Key Benefits of ABC Analysis

ABC analysis delivers clear, practical benefits for inventory-heavy businesses. By focusing effort where value is highest, companies can cut costs, improve planning, and strengthen supplier relationships.
1. Better Stock Prioritisation and Resource Allocation
ABC analysis helps a business focus time, space, and labour on what matters most. High-value items receive priority placement, tighter security, and more management attention.
This approach prevents teams from wasting effort on low-impact stock. As a result, warehouse operations run faster and decision-making becomes more strategic.
2. Reduced Carrying Costs and Waste
Inventory holding costs can drain cash flow if left unchecked. ABC analysis highlights which items tie up the most capital and where reductions make the biggest difference.
By keeping lean stock levels for Class A items and bulk ordering Class C items, a business lowers storage costs and avoids dead stock building up over time.
3. Improved Demand Forecasting Accuracy
Not every SKU needs advanced forecasting. ABC analysis allows a company to match forecasting effort with item importance.
Class A items justify detailed analysis, while Class C items rely on simple reorder rules.
This balance improves overall accuracy without overloading planning teams and aligns closely with the chosen stock pricing method, ensuring inventory value is calculated consistently.
4. Stronger Supplier Negotiation Leverage
Knowing which items drive most spending strengthens supplier negotiations. Businesses can use Class A volumes to secure better pricing, lead times, and service levels.
For Class C items, the focus shifts to automation and cost minimisation. This split strategy improves purchasing outcomes across the board.
How to Conduct an ABC Analysis
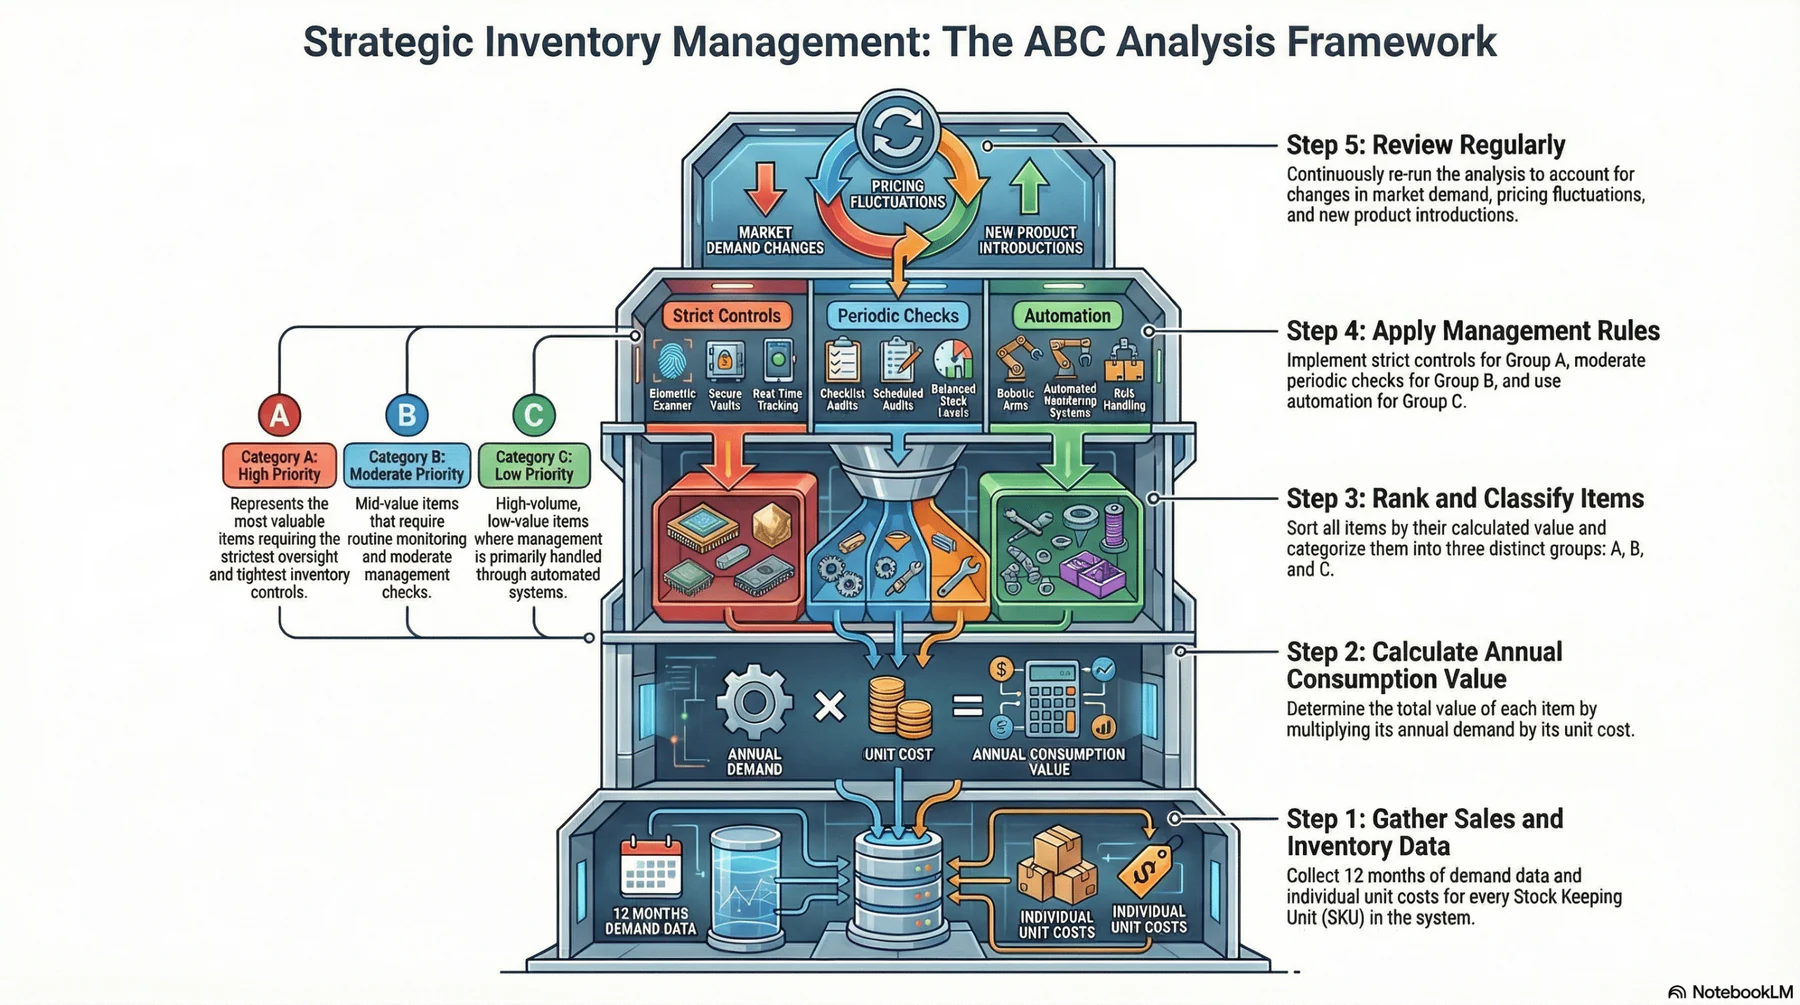
ABC analysis is simple in theory but works best with clean data and clear steps. Below is a streamlined process you can easily turn into action points.
- Step 1, Gather Sales and Inventory Data: Collect 12 months of demand and unit cost data for every SKU.
- Step 2, Calculate Annual Consumption Value: Multiply annual demand by unit cost for each item.
- Step 3, Rank and Classify Items: Sort items by value and split them into A, B, and C groups.
- Step 4, Apply Management Rules: Use strict controls for A, moderate checks for B, and automation for C.
- Step 5, Review Regularly: Re-run the analysis as demand, pricing, and products change.






ABC Analysis Across Industries
ABC analysis adapts easily across industries, but the way a business applies it depends on demand patterns, risk levels, and operational priorities. Below are common examples of how different sectors use this method in practice.
1. Retail and E-commerce
Retailers use ABC analysis to protect fast-moving, high-margin products. Class A items sit in prime shelf locations or forward-pick zones to prevent missed sales. Low-value accessories and clearance stock fall into Class C and rely on automated bulk replenishment.
2. Manufacturing and Production
Manufacturers focus ABC analysis on keeping production lines running. Class A items often include specialised components with long lead times that need close supplier coordination. Class C items like bolts and packaging use simple reorder systems to avoid delays.
3. Healthcare and Pharmaceuticals
In healthcare, cost and criticality go hand in hand. Class A items include expensive medicines and surgical components that need strict tracking and controlled storage. Class C items such as gloves and syringes are stocked in large volumes to ensure constant availability.
4. Food and Beverage
Food businesses apply ABC analysis with a strong focus on shelf life. Class A items tend to be high-turnover or premium products that need frequent replenishment. Low-cost ingredients and packaging sit in Class C and are ordered in bulk to reduce costs.
5. Construction and Project-Based Industries
Construction companies use ABC analysis to manage project timelines. Class A items include critical materials that can stop work if delayed. Class C items like fasteners and safety consumables are kept in surplus to prevent site downtime.
Common Pitfalls to Avoid
One common mistake is treating ABC categories as permanent. Demand, pricing, and product relevance change, so a business must review classifications regularly to stay accurate.
Another issue is ignoring item criticality. A low-value item may still be essential if its absence stops production or delivery, which calls for extra controls beyond its ABC rank.
Many businesses also rely too heavily on historical data. Past sales alone cannot account for upcoming promotions, seasonality, or market shifts.
Finally, poor data quality undermines the entire process. Inaccurate costs or demand figures lead to flawed decisions and misplaced priorities.
Advanced Practices: Beyond Basic ABC
Mature supply chains often expand ABC analysis with additional criteria. Factors like lead time, supplier reliability, and obsolescence risk help refine stock strategies.
Another common approach is ABC-XYZ analysis. ABC ranks items by value, while XYZ groups them by demand stability, from predictable to highly volatile.
Combining both models allows a business to apply precise controls. Predictable high-value items need lean stock, while volatile high-value items require flexible buffers and closer monitoring.
Many growing companies adopt an inventory system for Australian businesses to support these advanced strategies at scale.
Conclusion
ABC analysis gives a business a practical way to regain control over inventory without adding complexity. By focusing attention on the products that drive the most value, teams can reduce waste, protect cash flow, and make better stock decisions across retail, manufacturing, and distribution.
When applied consistently and reviewed regularly, ABC analysis becomes a long-term advantage rather than a one-off exercise.
If you want expert guidance on applying ABC analysis to your own inventory setup, consult our experts for tailored recommendations.
Frequently Asked Questions About ABC Analysis
What is ABC analysis used for?
ABC analysis helps a business prioritise inventory by identifying which items contribute the most value, allowing better stock control and resource allocation.
How often should ABC analysis be reviewed?
Most businesses should review ABC classifications at least annually, or more often if demand, pricing, or product ranges change frequently.
Is ABC analysis suitable for small businesses?
Yes. Even small businesses benefit from ABC analysis because it highlights where limited cash and time should be focused.
Can ABC analysis work with automated inventory systems?
Absolutely. ABC categories often improve automation by setting different reorder rules for high, medium, and low-value items.
What is the difference between ABC and ABC-XYZ analysis?
ABC focuses on item value, while XYZ adds demand stability, giving a more detailed view of inventory behaviour.