















Navigating corporate finance requires a clear understanding of how a company funds its growth. Every business must strike a careful balance between using its own equity and borrowing external funds. This capital structure is the foundation for managing risk, ensuring long-term stability, and maximizing shareholder value.
Relying too heavily on borrowed money exposes a business to significant vulnerabilities. As highlighted in resent research of corporate financial risk and capital structure, high leverage severely restricts managerial flexibility. The study, which analyzed over 1,200 firm-year observations, revealed a stark negative correlation (Coefficient = -9.399, p < 0.001) between a firm’s gearing ratio and its capacity to fund long-term sustainability initiatives. However, avoiding debt altogether can mean missing out on critical expansion opportunities.
To measure this delicate balance, analysts and managers rely on the gearing ratio. By using the proper gearing ratio formula, stakeholders gain a clear, mathematical snapshot of a company’s leverage. It strips away qualitative noise, revealing exactly how much of the business is funded by creditors versus shareholders to guide sound strategic planning.
Key Takeaways
Gearing ratio is to measures the proportion of a company’s operations funded by interest-bearing debt versus shareholder equity.
You should know about the steps before you implements gratio formula, include : Obtain the latest financial statements, Isolate interest-bearing liabilities, calculate shareholder equity, select appropriate formula, calculate.
There’s a common mistake calculating and interpreting the gearing ratio formula, including : Ignoring off-balance sheet financing, overlooking the cost of debt, failing to benchmark by industry, confusing book value
Gearing Ratio vs. Debt-to-Equity Ratio: Key Differences
The Impact of Gearing on Financial Risk and Return
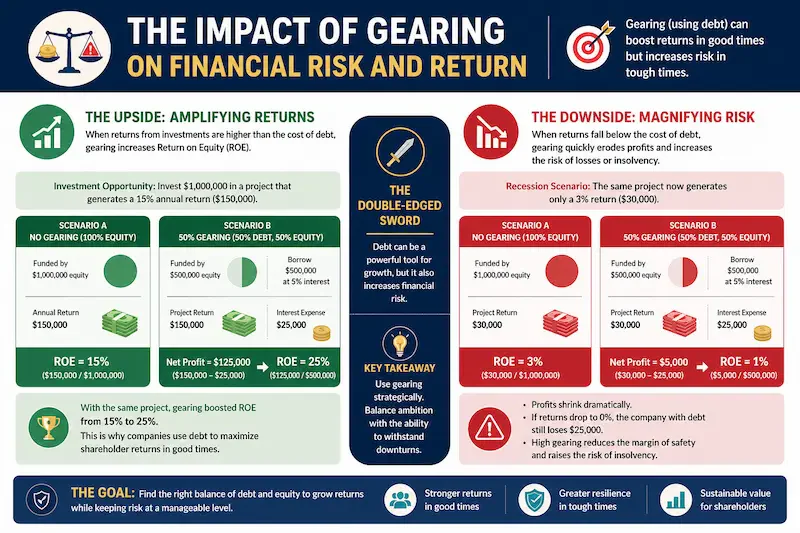
The strategic decision of how to structure a company’s capital and consequently, its gearing ratio has a profound impact on both the risk profile of the business and the potential returns for its investors. This dynamic is often referred to as the “double-edged sword” of financial leverage.
The Leverage Effect on Profitability
To understand the upside of gearing, one must understand how debt can amplify returns. Imagine a company that has an opportunity to invest RM1,000,000 in a new production facility that will generate a 15% annual return (RM150,000).
Scenario A: Zero Gearing (100% Equity) If the company uses RM1,000,000 of shareholder equity to fund the project, the return on equity (ROE) is simply 15% (RM150,000 return / RM1,000,000 equity).
Scenario B: 50% Gearing (50% Debt, 50% Equity) Now, suppose the company funds the project with RM500,000 of equity and borrows RM500,000 from a bank at an annual interest rate of 5%. The project still generates RM150,000. However, the company must pay RM25,000 in interest (RM500,000 × 5%). The net profit is RM125,000 (RM150,000 – RM25,000). Now, calculate the ROE: RM125,000 net profit / RM500,000 equity = 25%. By introducing debt (gearing), the company successfully amplified the shareholders’ return on investment from 15% to 25%.
This mathematical phenomenon is why private equity firms and aggressive corporate managers frequently utilize high gearing ratios; it is a powerful tool for maximizing shareholder wealth during good economic times. However, this aggressive use of debt remains under the strict scrutiny of tax authorities.
In Malaysia, the Inland Revenue Board (LHDN) monitors these practices through Section 140C and Earning Stripping Rules (ESR) to ensure that companies do not utilize excessive interest expenses to artificially diminish their taxable income. Proper alignment with these regulations is vital to avoid the disallowance of interest deductions and costly penalties for non compliance.
Risks During Economic Downturns
The downside of gearing becomes apparent when the economic environment shifts. Let us revisit the previous example, but imagine a severe recession hits, and the new production facility only generates a 3% return (RM30,000).
- Scenario A: Zero Gearing The company makes RM30,000. The ROE drops to 3%. While disappointing, the company is fundamentally safe. It has no mandatory interest payments to make.
- Scenario B: 50% Gearing The project generates RM30,000, but the company still owes the bank RM25,000 in fixed interest payments. The net profit is reduced to a mere RM5,000. The ROE plummets to 1% (RM5,000 / RM500,000). Worse still, if the project generated a 0% return, the company with zero gearing simply breaks even. The geared company, however, loses RM25,000 and must fund that interest payment from cash reserves or by selling assets.
This illustrates how high gearing ratios drastically compress the margin of error for a business and elevate the risk of insolvency during difficult periods.
Sector-Specific Gearing Ratio Benchmarks
A common mistake made by novice financial analysts is attempting to evaluate a gearing ratio in a vacuum. A ratio of 60% might be dangerously high for one type of business but perfectly normal and even optimal for another. To conduct a comprehensive financial ratio analysis, one must compare the company’s gearing against specific industry benchmarks.
Capital-Intensive Industries
Industries that require massive upfront investments in physical assets naturally operate with higher gearing ratios.
- Telecommunications and Utilities: Companies in these sectors must build extensive infrastructure (cell towers, power plants, electrical grids) before they can generate a single dollar of revenue. Because these companies typically enjoy highly stable, predictable, and often regulated cash flows, banks are willing to lend them massive sums of money. It is not uncommon to see utility companies operating safely with gearing ratios between 60% and 80%.
- Airlines and Shipping: Purchasing fleets of aircraft or cargo ships requires billions of dollars. These industries rely heavily on debt financing and lease agreements. Consequently, their gearing ratios are historically high, making them highly sensitive to fuel price shocks and global economic slowdowns.
- Real Estate Investment Trusts (REITs): Real estate is inherently a debt-driven industry. REITs use mortgages to acquire properties, aiming to generate rental income that exceeds the mortgage interest. A gearing ratio of 50% to 70% is standard in commercial real estate.
Asset-Light and Technology Sectors
Conversely, industries that do not require significant physical infrastructure typically operate with much lower gearing ratios.
- Software as a Service (SaaS) and Technology: Tech companies rely on intellectual property and human capital rather than factories and machinery. Because their assets are largely intangible, banks are often hesitant to provide traditional debt financing. Furthermore, the rapid pace of technological change makes their future cash flows less predictable than a utility company. As a result, tech companies usually rely heavily on venture capital and equity financing, resulting in gearing ratios that are frequently below 20%, and sometimes completely debt-free.
- Consulting and Professional Services: Law firms, accounting agencies, and management consultants require very little capital to operate. Their primary expense is payroll. Therefore, they have little need for long-term debt, and their gearing ratios are typically negligible.
When evaluating a company’s gearing ratio formula output, the analyst must ask: “Is this ratio appropriate for the specific operational realities and cash flow predictability of this specific industry?”
Strategies to Manage and Improve Your Gearing Ratio
A company’s gearing ratio is not static; it fluctuates continuously as debts are paid down, new loans are taken out, and profits are generated or lost. Corporate management teams must actively manage their capital structure to maintain an optimal gearing ratio. If a company finds its gearing ratio has drifted too high or too low, several strategic levers can be pulled.
Strategies for Reducing a High Gearing Ratio (Deleveraging)
If a company is over-leveraged and facing pressure from creditors or the threat of a credit downgrade, management must take steps to reduce the gearing ratio.
- Debt Repayment via Retained Earnings: The most organic way to reduce gearing is to improve operational profitability and use the excess cash flow to aggressively pay down principal debt balances. This reduces the numerator in the gearing ratio formula.
- Equity Issuance: A company can issue new shares of common or preferred stock to the public or private investors. The capital raised is then used to retire debt. This is a highly effective dual-action strategy: it simultaneously decreases total debt (the numerator) and increases total equity (the denominator), causing the gearing ratio to drop rapidly. However, this strategy dilutes the ownership percentage of existing shareholders.
- Asset Sales and Divestitures: Management can choose to sell off non-core assets, underperforming divisions, or excess real estate. The cash generated from these sales is immediately deployed to pay off debt.
- Reducing Dividend Payments: By cutting or suspending dividend payments to shareholders, a company retains more of its net income within the business. This increases the retained earnings account, which boosts total equity and naturally lowers the gearing ratio over time.
Strategies for Increasing a Low Gearing Ratio (Leveraging Up)
If a company is under-leveraged and wishes to optimize its cost of capital and boost shareholder returns, it can employ strategies to increase its gearing.
- Debt-Funded Expansion: The company can take out bank loans or issue corporate bonds to finance the acquisition of a competitor, build new manufacturing facilities, or heavily fund research and development. This increases the numerator in the formula.
- Share Repurchases (Buybacks): A highly popular strategy in modern corporate finance is using cash reserves—or even borrowing money specifically for this purpose—to buy back the company’s own shares on the open market. When shares are repurchased, they are retired, which reduces total shareholder equity (the denominator). This mathematically increases the gearing ratio and concentrates future earnings among a smaller pool of remaining shares, driving up Earnings Per Share (EPS).
- Special Dividends: The company can issue a massive, one-time cash payment to shareholders. This drastically reduces retained earnings (lowering equity) and pushes the gearing ratio upward.
Common Mistakes When Analyzing Gearing Ratios

Even seasoned financial professionals can make errors when calculating and interpreting the gearing ratio formula. Being aware of these common pitfalls is essential for accurate financial analysis.
Ignoring Off-Balance Sheet Financing
A dangerous pitfall is missing off-balance sheet liabilities, such as operating leases, which can make a company’s debt look artificially low. While modern accounting rules have closed many of these loopholes by requiring leases to be recorded, you must still carefully check the financial footnotes to ensure all hidden, debt-like obligations are included in your calculations.
Overlooking the Cost of Debt
A high gearing ratio isn’t always bad if the borrowed money is cheap. Analysts often focus on total debt volume while ignoring the interest rates. Locked-in, low fixed rates mean efficient capital use, whereas variable rates can quickly cause a cash flow crisis. Always pair the gearing ratio with the interest coverage ratio to assess true debt affordability.
Failing to Benchmark by Industry
Comparing gearing ratios across different sectors is a major analytical error. Capital-intensive industries like real estate naturally carry higher debt, so a 60% ratio might be perfectly healthy. However, that exact same ratio could signal severe distress for a software startup. Always benchmark a company’s leverage strictly against direct competitors and historical industry averages.
Confusing Book Value with Market Value
When calculating equity, analysts often default to the historical “book value” found on the balance sheet. This can severely understate a company’s true worth, especially for modern businesses with strong intangible assets. Using the market value of equity (market capitalization) often provides a much more realistic picture, preventing a robust company from appearing artificially over-leveraged.
Advanced Practices in Leverage Analysis
To gain a truly comprehensive view of financial leverage, advanced practitioners never look at the gearing ratio in isolation. Instead, they employ dynamic trend analysis, tracking the ratio over multiple quarters or years. This longitudinal approach helps identify deliberate shifts in corporate strategy, such as a multi-year deleveraging plan, or serves as an early warning system for emerging financial distress.
Advanced financial modeling also involves stress-testing the gearing ratio under various adverse economic scenarios. Analysts will model how a sudden 2% hike in interest rates or a 15% drop in operating revenue would impact the company’s ability to maintain its current capital structure.
Furthermore, seasoned professionals consistently pair gearing metrics with the interest coverage ratio. While the gearing ratio formula calculates the absolute, structural level of debt, the interest coverage ratio reveals whether the company generates sufficient operating income (EBIT) to actually service that debt. Combining these two metrics provides a holistic, bulletproof assessment of both capital structure composition and long-term debt sustainability.
Conclusion
The gearing ratio is a vital tool for assessing a company’s financial structure and long-term health. It clearly illustrates the balance between interest-bearing debt and shareholder equity. By providing a mathematical snapshot of leverage, it helps stakeholders ignore qualitative noise. Maintaining this balance is essential for ensuring stability while pursuing aggressive growth. It remains a foundational metric for any robust risk management strategy.
Correct interpretation depends heavily on industry benchmarks and current economic conditions. Analysts must look beyond simple percentages to evaluate debt maturity and interest rates. A ratio that works for a utility company may signal crisis for a tech startup. Avoiding common pitfalls requires a deep dive into financial footnotes and market values. This comprehensive view allows for better strategic navigation during market shifts.
Calculating these metrics manually often increases the risk of errors and strategic delays. Modern businesses rely on automated tools for real-time visibility into their capital structure. Advanced software streamlines reporting, ensuring your financial data is always accurate and actionable. This efficiency allows leadership to focus on high-level goals rather than manual data entry. To see how our system simplifies financial analysis, schedule a free demo today.

FAQ About Gearing Ratio Formula
How do creditors and investors view high gearing differently?
Creditors prioritize capital preservation and use the gearing ratio to assess default risk, often setting “debt covenants” to limit borrowing. Conversely, investors often favor strategic gearing as a tool to amplify Return on Equity (ROE) and maximize shareholder wealth during periods of economic growth.
Why should analysts scrutinize financial footnotes when calculating gearing?
Footnotes often reveal “hidden” or off-balance sheet liabilities, such as operating leases and contingent debts, that are not visible on the main balance sheet. Ignoring these details can result in an artificially low gearing ratio, leading to a false sense of financial security.
Why is a “good” gearing ratio entirely dependent on the industry?
Capital-intensive sectors like utilities or real estate can safely handle higher gearing due to stable, predictable cash flows. In contrast, asset-light industries like SaaS or technology typically maintain low gearing because their lack of physical collateral makes high debt loads much riskier.
How does debt maturity affect the interpretation of a gearing ratio?
The gearing ratio only shows the volume of debt, not when it is due. A company with high short-term debt faces immediate refinancing risks if interest rates rise, whereas a company with long-term, fixed-rate debt is much more stable, even if their total gearing percentages are the same.
Why is it important to pair gearing with the interest coverage ratio?
While the gearing ratio measures the structural composition of capital, the interest coverage ratio measures a company’s ability to pay its interest obligations from current earnings. Together, they confirm if a company’s debt levels are both structurally sound and operationally sustainable.